|
Flow Charts
|
|
|
Prior to the mid 1970s, software design, if there was any, may have been aided by the
use of Flow Charts. These were diagrams of how the various parts of a program interacted.
It was primarily Procedural Oriented as opposed to Object Oriented. A Flow Chart
displayed graphically the "flow of control" through a program.
|
|
Object Oriented Modeling Languages
|
|
|
From the mid 1970s to the late 1980s a number of new software "modeling languages"
appeared. The three developers who stand out for their work during this period
are: (1) Grady Booch of Rational Software Corporation
who developed the Booch Method, (2) Ivan Jacobson of Objectory, Inc.
who developed Object Oriented Software Engineering, and (3) James Rumbauch
of General Electric who developed the Object Modeling Technique.
|
|
Unified Modeling Language
|
|
|
Booch, Jacobson, and Rumbaugh were independently working toward the same objectives.
In the mid 1990s they began collaborating. The result was the Unified Modeling Language
of which the first version (then called just the Unified Method) was released in October of 1995.
|
|
Seven Types of Structural Things
|
|
1. Class - An object with defined attributes and operations.
A class in UML is very much like a class in C++.
|

|
|
2. Interface - A collection of functions that specify a service of a
class or component, i.e. externally visible behavior of that class.
|

|
|
3. Collaboration - A larger pattern of behaviors and actions.
Example: All classes and behaviors that create the modeling of a moving tank in a simulation.
|

|
|
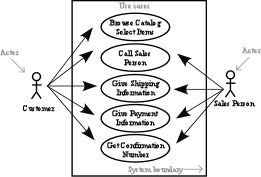
4. Use Case - A sequence of actions that a system performs that yields an
observable result. Used to structure behavior in a model. Is realized by a collaboration.
|

|
|
5. Active Class - Like a class but its represents behavior that runs concurrent
with other behaviors, i.e. threading.
|

|
|
6. Component - A physical and replaceable part of a system that implements a
number of interfaces. Example: a set of classes, interfaces, and collaborations.
|

|
|
7. Node - A physical element existing at run time and represents a resource.
|

|
|
Nine Types of Diagrams
|
|
1. Class Diagram - A set of classes, interfaces, and collaborations and their
relationships. Most often found in modeling OO systems.
|

|
|
2. Object Diagram - A set of objects and their relationships. Represents
static instances of things found in class diagrams.
|

|
|
3. Use Case Diagram - A set of Use Cases and actors.
|
|
|
4. Sequence Diagram - An interactive diagram (set of objects, relationships,
and messages that may be exchanged) emphasizing the time-ordering of messages.
|

|
|
5. Collaboration Diagram - An interaction diagram emphasizes the structural
organization of the objects that send and receive messages.
|

|
|
6. Statechart Diagram - Shows a state machine with states, transitions, events, and activities.
|

|
|
7. Activity Diagram - Special type of statechart diagram that shows the flow
from activity to activity within a system.
|

|
|
8. Component Diagram - Shows the organizations and dependencies among a set of components.
|

|
|
9. Deployment Diagram - Shows the configuration of run-time processing nodes and
the components that are part of them.
|

|